One step closer to the App Store: What’s Left’s new beta version is available!
We have postponed the launch of the app into the App Store for a while, but we are strongly determined to achieve this goal as soon as possible. We’re getting closer and closer. Since the last version in November, we have improved a lot of What’s Left’s functionalities as well as its usability.
Check it out by installing the new version via TestFlight. If you haven’t installed What's Left yet, click here to do so.
Here are our release notes for the new version:
Improvement of recipe predictions.
We improved the quantity selection of stock items in the recipe view. It is now possible to enter specific quantities for a given ingredient, thus greatly increasing the accuracy of the recipe prediction.
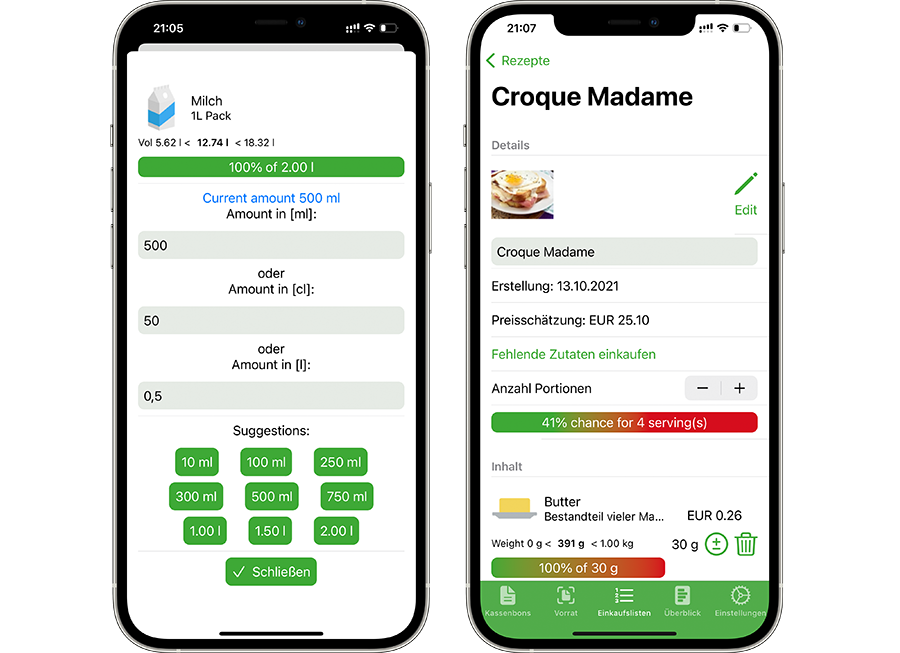
Possibility to add the quantity of an item on a shopping list.
Until now, it was only possible to add a predefined quantity, by default equal to the defined stock item threshold. Similar to the recipe view, it is now possible to add any quantity to a shopping list item.
Recipes sorting
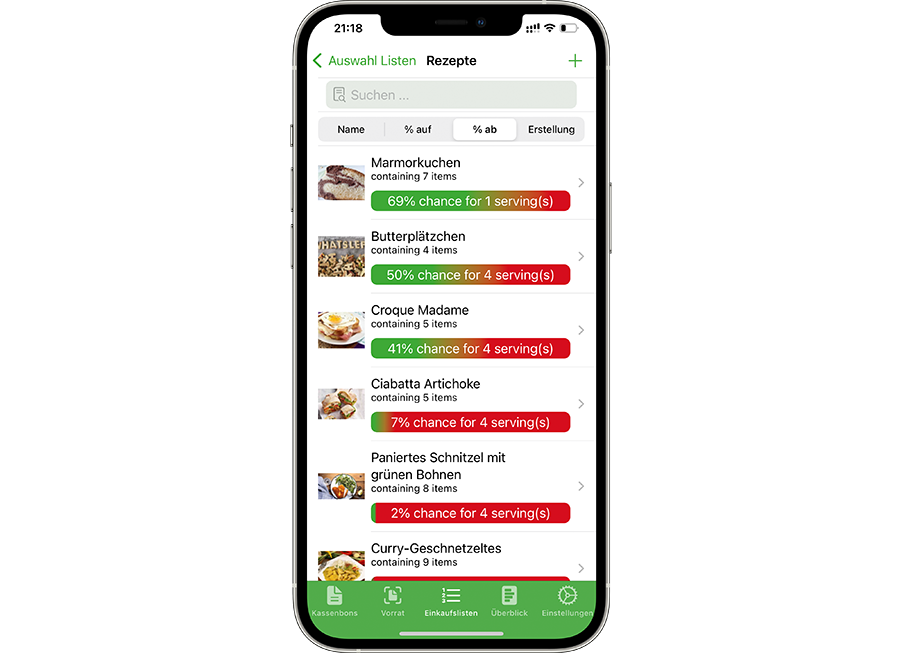
We can now sort recipes by name, by creation date, or by recipe cooking probability (ascending or descending).
Increased receipt processing performance
We improved the receipt processing performance. The scanning of a receipt is now much faster and only takes a few seconds.
Recipe cost estimation
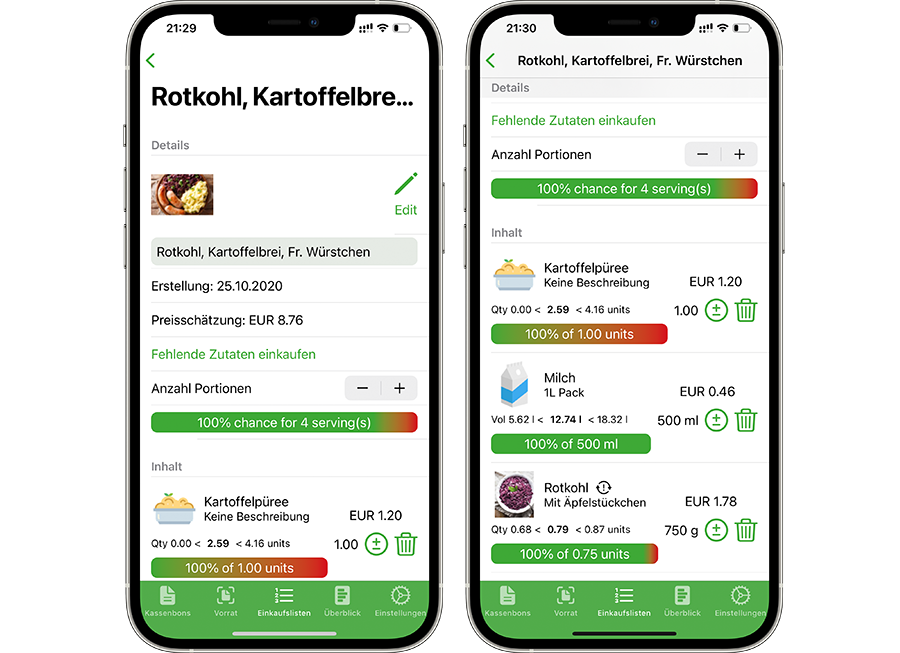
For each recipe, a cost estimation is now calculated and displayed. Moreover, an average price is displayed for each ingredient. The average price is based on all items added to a stock, and calculated according to the entered quantity.
Shopping list cost estimation & distribution
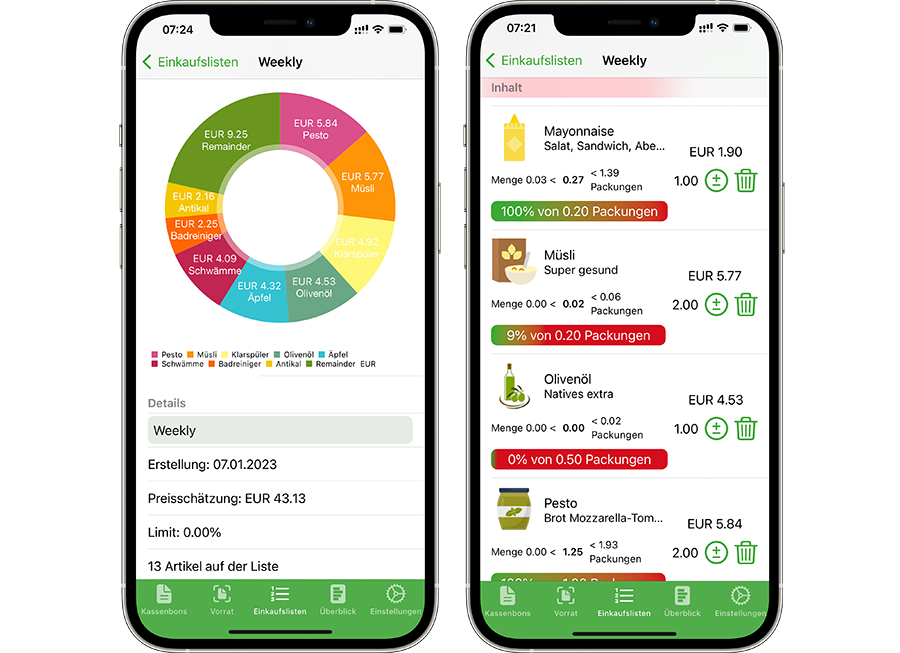
Analogously to the recipe cost estimation, the shopping list view now has a new entry with the cost estimation of all the included shopping list items. Each shopping list item now offers an average price, based on all previously bought items. This makes it possible to identify the possible costs even before shopping and to plan expenses more easily. That way, at the supermarket, you can quickly see if an item is cheaper or more expensive than average. This way you can avoid unpleasant surprises during checkout. Also, the shopping list now has a new graphical component, displaying the cost distribution.
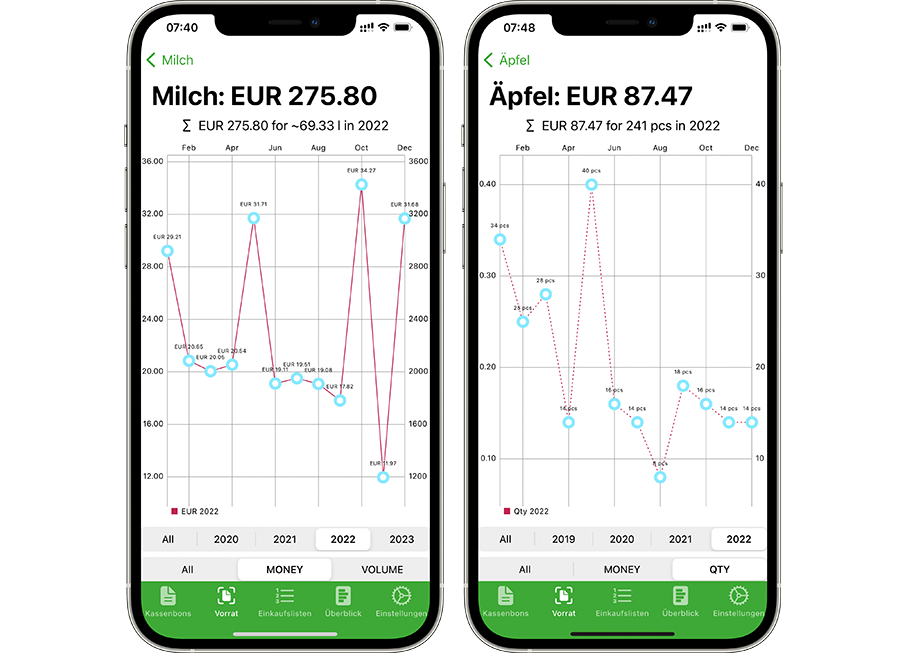
Addition of filters on the stock evolution charts
For each stock item, it is now possible not only to filter its evolution per year, but also per costs and quantity. Below the example of the milk and apple stock item. In 2022, 275,80 Euro were spent on milk for 62,29 liters. The graph shows that milk cost the most in October and December. On the right-hand side, the quantity of bought/consumed apples. Consumption was at its peak around May before decreasing for the rest of the year.
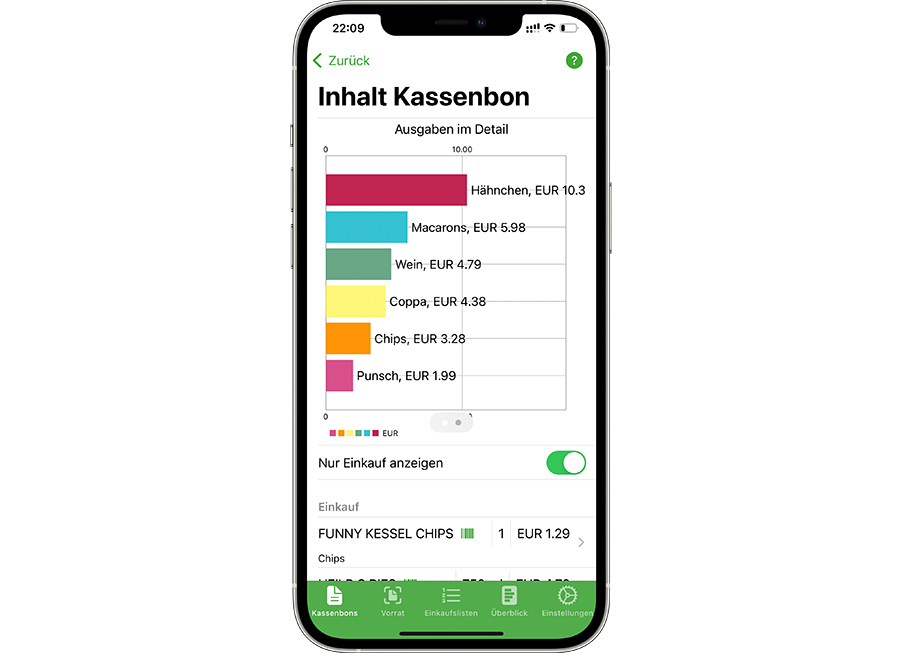
Additional chart on the receipt view.
On top of a pie chart to represent the item distribution, we now have a bar chart, which can be found at the top of the receipt view.
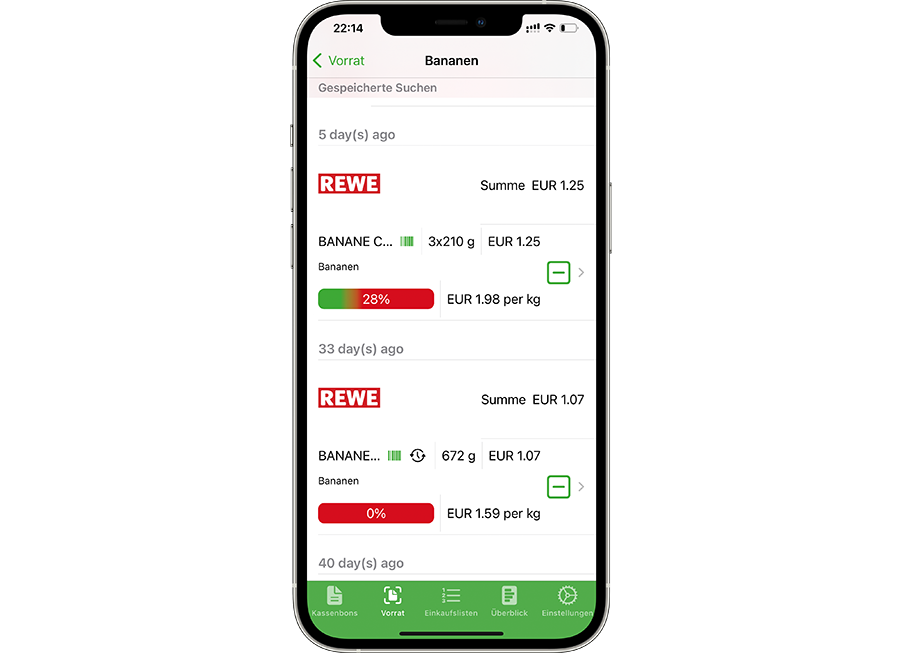
Items within a stock are now clustered
We improved the layout of the saved items within a stock. They are now clustered. First by date, then by supermarket.
Completion of the translations
In different areas of the app, we had no available translations and thus showed the default English language. We now have created German and French translations, and updated the app. (NB: the translations are not included in the screenshots in this article)
Bug Fixes
We improved the user experience by fixing various functional bugs.
